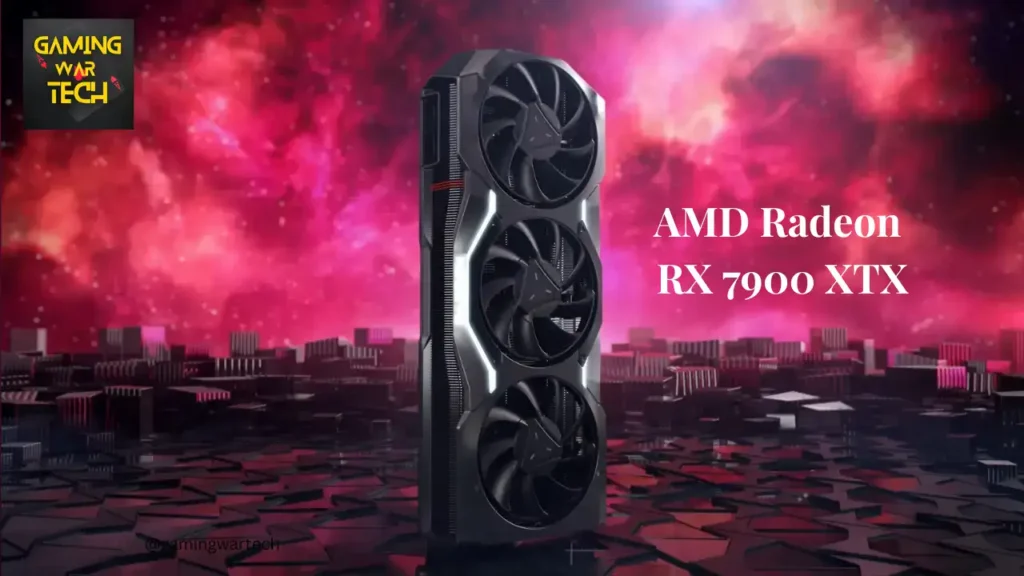
AMD Radeon RX 7900 XTX is an Enthusiast-class Desktop graphics card launched on Nov 3rd, 2022 by AMD. It is a 4K gaming GPU based on RDNA 3 Architecture which belongs to the Radeon RX family.
I have collected all the data from reputable sites like Techpowerup, AMD Official site, and YouTube channels like Hardware Unboxed, Gamers Nexus, etc. for the specs and performance of the AMD Radeon RX 7900 XTX graphics.
Let’s dive into all the capabilities, specs, benchmarks, and gaming performance of the Radeon RX 7900 XTX GPU.
AMD Radeon RX 7900 XTX Info
All the basic information about the Radeon RX 7900 XTX GPU is presented such as GPU Architecture, market segment, codename, and price.
It includes 2nd generation Ray Tracing cores and Infinity cache.
| GPU Codename | Plum Bonito |
| GPU Name | Navi 31 |
| GPU Variant | Navi 31 XTX (215-145000146) |
| Series | Radeon RX 7000 Series |
| Family | Radeon RX |
| Architecture | RDNA 3.0 |
| Release date | Nov 3rd, 2022 |
| Generation | Navi III |
| Foundry | TSMC |
| Market Segment | Desktop |
| Production | Active |
| Predecessor | Navi II |
| Launched Price | $999 |
| Current Price | $911 – $999 |
Technical Specifications
The AMD Radeon RX 7900 XTX Specs include compute units, number of shaders, pixel rate, texture filter rate, die size, density, TDP, process size, Vram, and more.
It also includes 2nd generation Ray Tracing cores and Infinity cache.
| Compute Units | 96 CUs |
| Shaders / Stream Processors | 6144 Units |
| TMUs (Texture Mapping Units) | 348 |
| ROPs (Raster Operation Pipeline) | 192 |
| RayTracing Cores | 96 |
| AI Accelerators | 192 |
| L0 Cache | 64 KB per WGP |
| L1 Cache | 256 KB per Array |
| L2 Cache | 6 MB |
| L3 Cache | 96 MB |
| Transistors | 57.7 billion |
| Process Size | 5 nm |
| Die Size | 529 mm² |
| Density | 109.1M / mm² |
| Chip Package | MCM |
| Pixel Rate | 480 GPixels/s |
| Texture Rate | 960 GTexels/s |
Board Design
| TDP (Total Draw Power) | 355W |
| Minimum Power Supply Req. | 800W |
| Slot Width | Dual Slot (2.5) |
| Card Dimensions (L X W X H) | 287 mm x 110 mm x 51 mm (11.3 inches x 4.3 inches x 2 inches) |
| Outputs | 1x HDMI 2.1a, 2x DisplayPort 2.1, 1x USB Type-C |
| Bus Interface | PCIe 4.0 x16 |
| Power Connectors | 2x 8-pin |
GPU Frequencies
In desktop/notebook GPUs, the graphics cards are tuned according to their manufacturers/Board partners, depending on which frequencies they want in their notebook/desktop GPUs.
If they want power efficiency, they want to tune the frequencies lower than normal, resulting in less power consumption and loss of performance.
If they want performance, they will either let the frequencies default or tune the frequencies a little higher for more performance. Hence, the GPU will consume more power.
The Higher the clock speed, the better the performance of the GPU.
| Base Clock | Game Clock | Boost Clock | FP16 (Half) | FP32 (Float) | FP64 (Double) |
|---|---|---|---|---|---|
| 1.929 GHz | 2.365 GHz | 2.498 GHz | 122.8 TFLOPS | 61.4 TFLOPS | 1.92 TFLOPS |
The above data is a theoretical performance of AMD RX 7900 XTX as Navi 31 die has a total of 12288 Shaders but they are counted 6144 Shaders due to dual issue. so the GPU performance in gaming is 30.7 TFLOPS.
Video Memory (VRAM) capacity and Type
It tells how much VRAM Radeon RX 7900 XTX GPU has, VRAM type, size, bus, and bandwidth. This is a discrete video card so RX 7900 XTX VRAM size is 24GB GDDR6.
| Memory Size | 24 GB |
| Memory Type | GDDR6 |
| Memory Bus | 384 bit |
| Memory Clock | 2.50 GHz 20 Gbps effective |
| Bandwidth | 960 GB/s |
| Effective Memory Bandwidth | 3500 GB/s |
API Features Support
Graphical API features supported by AMD Radeon RX 7900 XTX graphics card are:
| DirectX | 12 Ultimate (12_2) |
| OpenGL | 4.6 |
| OpenCL | 2.2 |
| Vulkan | 1.3 |
| Shader Model | 6.7 |
Hardware Codec Support
Hardware codecs supported by this GPU are:
| h264 | Decode / Encode |
| AV1 | Decode / Encode |
| h265 / HEVC (8-bit) | Decode / Encode |
| h265 / HEVC (10-bit) | Decode / Encode |
| VP8 | Decode / Encode |
| VP9 | Decode / Encode |
Other Features Support
| HDMI 4K Support | Yes |
| HDCP-Version | 2.3 |
| Max. Resolution Support | 7680 x 4320 |
| Max. Display Support | 4 |
| AMD FidelityFX Super Resolution (FSR) | Yes |
| AMD Noise Suppression | Yes |
| AMD Radeon Super Resolution | Yes |
| AMD Smart Access Memory | Yes |
| AMD Smart Access Video | Yes |
| VSR(4K) | Yes |
| AMD Radeon Boost | Yes |
| AMD Radeon Anti-Lag | Yes |
| AMD Radeon Image Sharpening | Yes |
| AMD Enhanced Sync Technology | Yes |
| AMD FreeSync | Yes |
| AMD Radeon Chill | Yes |
| AMD Virtual Super Resolution | Yes |
Synthetic Benchmark Performance
These benchmarks are measured by GPU benchmarking software like 3DMark Time Spy graphics score, 3DMark Fire strike graphics, Passmark Performance Testsuite, Port Royal, and Geekbench 6.2.
What is the Passmark Performance Test suite?
The Passmark performance test suite is a 3D benchmark designed for video cards by using the DirectX feature.
It puts a load on the GPU for various DirectX versions like DX9, DX10, DX11, and DX12 provides separate benchmark results, and gives you the average G3D mark score.
What is the 3D Mark Time Spy benchmark?
It calculates both the CPU and GPU performance by rendering on 1440p resolution using DX12 API and gives you the system’s overall score. It also ranks your overall score on the internet and your system accordingly.
Time Spy Extreme also uses DX12 API for benchmarking a gaming PC to its fullest capabilities by rendering on 4K Ultra HD resolution.
What is the 3D Mark Fire Strike benchmark?
It is a standard to test your gaming PC graphics render capability in detail and complexity which is quite taxing to the gaming hardware. It uses DirectX 11 API and renders at 1080P resolution.
Fire Strike Extreme benchmark uses 1440p as a rendering resolution for gaming PCs. It enhances all the visuals by increasing the rendering load to measure the accurate performance of extreme hardware setups.
What is the 3D Port Royal benchmark?
The 3D Port Royal benchmark is used to measure the ray-tracing capability of a graphics card that supports Microsoft DXR. It renders the scenes at 1440p resolution.
What is the Geekbench 6 GPU benchmark?
Geekbench 6 GPU benchmarks your graphics card computing power in gaming, image processing, video editing, photography, and machine learning. It tests your GPU Open CL, metal, and Vulkan score.
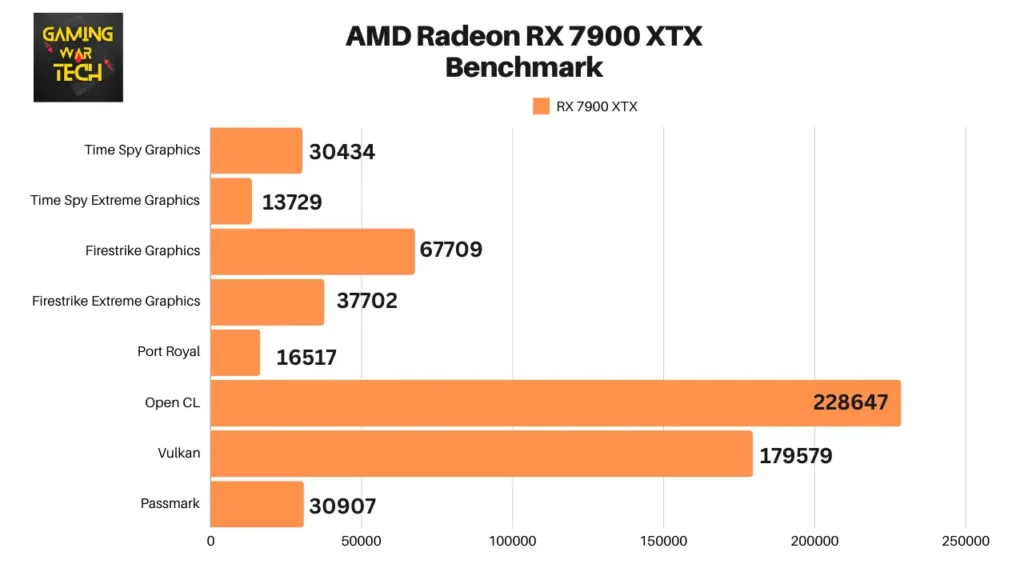
| Benchmark Tools | Radeon RX 7900XTX |
|---|---|
| Time Spy Graphics | 30434 |
| Time Spy Extreme Graphics | 13729 |
| Firestrike Graphics | 67709 |
| Firestrike Extreme Graphics | 37702 |
| Port Royal | 16517 |
| Open CL | 228647 |
| Vulkan | 179579 |
| Passmark | 30907 |
Gaming Performance
Gaming performance is to measure how well this integrated graphics card performs in gaming by running multiple games on it and calculating the average fps and 1% lows.
The test system used for this gaming benchmark is a Ryzen 7 7800X3D CPU, 32 GB DDR5-6000 MHz (CL30) RAM in dual channels, and Radeon RX 7900 XTX 24GB GDDR6 GPU.
RX 7900 XTX Gaming Benchmark Rasterization performance at 1080p

RX 7900 XTX Gaming Benchmark Rasterization performance at 1440p

RX 7900 XTX Gaming Benchmark Rasterization performance at 4K
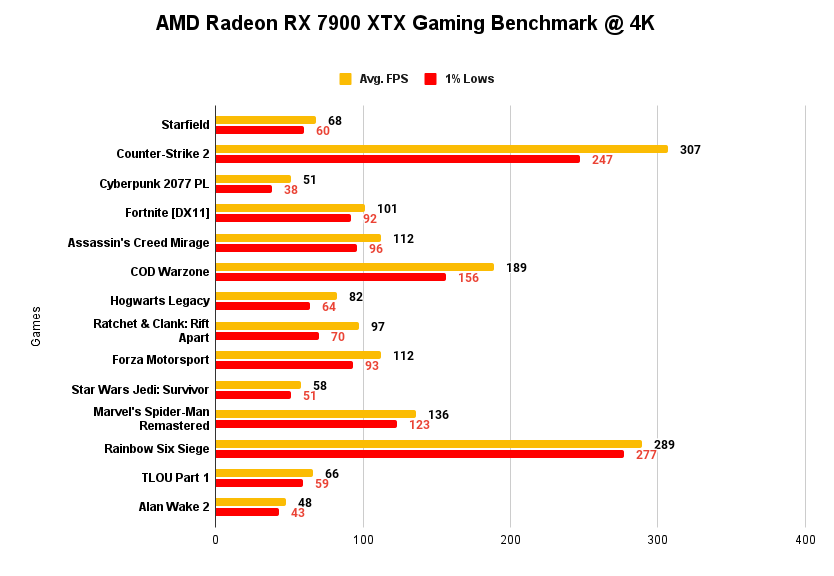
RX 7900 XTX Gaming benchmark (Rasterization) details in table format
| Games | 1080P Avg. FPS | 1080P 1% Lows | 1440p Avg. FPS | 1440p 1% Lows | 4K Avg. FPS | 4K 1% Lows | Graphics Settings |
|---|---|---|---|---|---|---|---|
| Starfield | 121 | 101 | 103 | 87 | 68 | 60 | Ultra |
| Counter-Strike 2 | 552 | 379 | 478 | 356 | 307 | 247 | Medium |
| Cyberpunk 2077 PL | 139 | 119 | 93 | 82 | 51 | 38 | Ultra |
| Fortnite [DX11] | 227 | 195 | 176 | 153 | 101 | 92 | Epic, TAA |
| Assassin’s Creed Mirage | 197 | 153 | 161 | 130 | 112 | 96 | Ultra High, TAA |
| COD Warzone | 208 | 164 | 206 | 164 | 189 | 156 | Basic |
| Hogwarts Legacy | 146 | 103 | 130 | 82 | 82 | 64 | Ultra |
| Ratchet & Clank: Rift Apart | 166 | 157 | 129 | 118 | 97 | 70 | V. High |
| Forza Motorsport | 148 | 121 | 143 | 121 | 112 | 93 | Ultra, TAA |
| Star Wars Jedi: Survivor | 171 | 139 | 113 | 91 | 58 | 51 | Epic |
| Marvel’s Spider-Man Remastered | 227 | 195 | 218 | 190 | 136 | 123 | V. High |
| Rainbow Six Siege | 808 | 733 | 581 | 543 | 289 | 277 | Medium |
| TLOU Part 1 | 141 | 128 | 114 | 102 | 66 | 59 | Ultra |
| Alan Wake 2 | 128 | 117 | 88 | 79 | 48 | 43 | High |
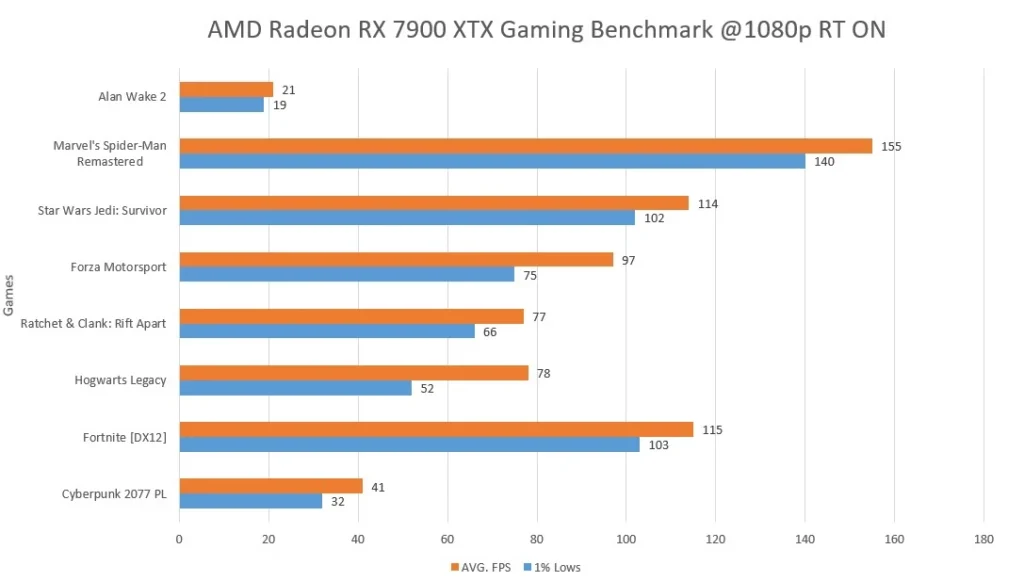
AMD Radeon RX 7900 XTX Gaming Benchmark at 1080p RT Enabled
AMD Radeon RX 7900 XTX Gaming Benchmark at 1440p RT Enabled

AMD Radeon RX 7900 XTX Gaming Benchmark at 4K RT Enabled

RX 7900 XTX Gaming benchmark (Ray Tracing) details in table format
| Games | 1080P Avg. FPS | 1080P 1% Lows | 1440p Avg. FPS | 1440p 1% Lows | 4K Avg. FPS | 4K 1% Lows | Graphics Settings |
|---|---|---|---|---|---|---|---|
| Cyberpunk 2077 PL | 41 | 32 | 29 | 22 | 15 | 12 | Ultra + RT Ultra |
| Fortnite [DX12] | 115 | 103 | 91 | 80 | 62 | 51 | Epic, TAA, HW RT, Lumen+Nanite=Epic |
| Hogwarts Legacy | 78 | 52 | 59 | 41 | 34 | 25 | Ultra + RT Ultra |
| Ratchet & Clank: Rift Apart | 77 | 66 | 57 | 50 | 31 | 25 | High + RT High |
| Forza Motorsport | 97 | 75 | 87 | 68 | 71 | 57 | Ultra, TAA, Full Reflections + RTAO |
| Star Wars Jedi: Survivor | 114 | 102 | 93 | 84 | 49 | 41 | Epic + RT |
| Marvel’s Spider-Man Remastered | 155 | 140 | 154 | 137 | 122 | 108 | High + RT High |
| Alan Wake 2 | 21 | 19 | 13 | 11 | 6 | 5 | High + RT High |
Is the AMD Radeon RX 7900 XTX good for 4K gaming?
Yes, the Radeon RX 7900 XTX 24GB is good for 4K gaming with great results and is a bit cheaper than its competitor. Ray Tracing’s performance on 4K is worse in some games.
What is the Radeon RX 7900 XTX Nvidia equivalent?
The Radeon RX 7900 XTX GPU beats the RTX 4080 and is equivalent to the Nvidia Geforce RTX 4080 Super.
AMD Radeon RX 7900XTX GPU by following 3rd Party Companies
The following 3rd Party companies or board partners of AMD GPUs are ASUS, Gigabyte, Sapphire, Power Color, XFX, ASRock, MSI, Biostar, Vestarmour, and Yeston.
AMD Radeon RX 7900XTX Founders edition was also launched but is currently unavailable. Founders edition GPUs are made by AMD rather than its board partners.

