Intel Core Ultra 9 285K is a High-End desktop Processor released on Oct 24th, 2024 by Intel, based on Arrow Lake architecture. It is a hybrid CPU with performance and efficiency cores.
I have collected all the data from reputable sites like Techpowerup, Intel’s Official site, and YouTube channels like Hardware Unboxed, Gamers Nexus, etc. for the specs and performance of the Core Ultra 9 285K CPU.
Let’s dive into all the capabilities, specs, benchmarks, and gaming performance of the Intel Core Ultra 9 285K CPU.
Intel Core Ultra 9 285K Info
All the basic information about the Intel Core Ultra 9 285K Arrow Lake is presented such as CPU Architecture, market segment, codename, and price.
| CPU Name | Core Ultra 9 285K |
| Series | Core Ultra Series 2 |
| Architecture | Arrow Lake-S |
| Release date | Oct 24th, 2024 |
| Generation | Core Ultra 9 (Series 2) |
| Foundry | TSMC |
| Market Segment | Desktop |
| Production | Active |
| Launched Price | $589 |
| Current Price | $589 – $619 |
Technical Specifications
The Intel core ultra 9 285K Specs include CPU cores, Cache, Clock speed, die size, TDP, process size, and more.
It includes Hybrid P + E cores which have a total of 15 TOPs with Intel NPU having 13 TOPs and iGPU having 8 TOPs. So Core Ultra 9 285K TOPs is 36 TOPs in total.
| Total CPU Cores | 24 Cores |
| CPU Threads | 24 Thread |
| Hyperthreading/SMT | No |
| Hybrid Cores | Performace + Efficiency |
| Performance Cores | 8 (Lion Cove) |
| Efficiency Cores | 16 (Skymont) |
| P-Cores Base Clock | 3.7 GHz |
| P-Cores Boost Clock | 5.5 GHz |
| P-Cores Boost Clock 3.0 | 5.6 GHz |
| P-Cores Max Turbo | Upto 5.7 GHz |
| E-Cores Base Clock | 3.2 GHz |
| E-Cores Boost Clock | 4.6 GHz |
| Bus Frequency | 100 MHz |
| Multiplier | 37.0x |
| Multiplier Unlocked | Yes |
| L1 Cache | 112 KB (per core) |
| L2 Cache | 3 MB (per core) |
| L3 Cache | 36 MB (shared, Smart Cache) |
| E-Core L1 Cache | 96 KB (per core) |
| E-Core L2 Cache | 4 MB (per module) |
| Total Cache | 40 MB |
Core Ultra 9 285K AI Performance
| NPU Name | Intel AI Boost |
| NPU Peak TOPs (INT8) | 13 Tops |
| Sparsity Support | Yes |
| Windows Studio Effects Support | Yes |
CPU Package
| Socket | LGA-1851 |
| Package | FC-LGA18W |
| TJ max | 105°C |
| Transistors | 17.8 billion |
| Process Size | 3 nm |
| Die Size | 243 mm² |
| TDP (Default) | 125W |
| PL1 | 250W |
| PL2 | 250W |
| PL2 Extreme | 295W |
Expansion Support
| Direct Media Interface (DMI) | 4 |
| Max DMI Lanes | 8 |
| Intel Thunderbolt 4 | Yes |
| PCI-e Support | 5.0 / 4.0 |
| Max PCI-E Lanes | 24 (20, Gen5 lanes + 4, Gen4 lanes) |
Core Ultra 9 RAM Support
It tells how much RAM Core Ultra 9 CPU Supports, what type, and what speed.
| Memory Size | 192 GB |
| Memory Type | Up to DDR5 6400 MT/s |
| Max Memory Speed | 6400 MHz |
| Max Memory Channels | Dual Channels |
| ECC Support | Yes |
RTX 4070 Super Bus Width is 192-bit, and RTX 4070 Super bandwidth is 504.2 GB/s.
ARC Xe2 Integrated Graphics Specs
Intel Core Ultra 9 285K CPU has ARC Xe2 64EUs IGPU. It has 4 Xe2-cores. It shares its memory with the system’s main memory.
| GPU Name | Intel ARC Xe2 Graphics |
| Xe2-Cores | 4 |
| Execution Unit | 64 |
| Shaders | 512 Units |
| Base clock | 300 MHz |
| Dynamic Boost Clock | 2 GHz |
| Max Resolution | 4K/8K 60 Hz |
| Max Display | 4 |
AI Features Support
AI features supported by the Intel Core Ultra 9 285K are:
| OpenVino | Yes |
| WindowsML | Yes |
| DirectML | Yes |
| ONNX RT | Yes |
| WebNN | Yes |
Hardware Codec Support
Hardware codecs supported by the Intel Core Ultra 9 285K processor are:
| h264 | Decode / Encode |
| AV1 | Decode / Encode |
| h265 / HEVC (8-bit) | Decode / Encode |
| h265 / HEVC (10-bit) | Decode / Encode |
| VP8 | Decode |
| VP9 | Decode |
| AVC | Decode / Encode |
| VC-1 | Decode |
| Jpeg | Decode / Encode |
Other Features Support
| Volume Management Device (VMD) | Yes |
| Gaussian & Neural Accelerator | 3.5 |
| Thread Director | Yes |
| Speed Shift Technology | Yes |
| Thermal Velocity Boost | Yes |
| Turbo Boost Max Technology 3.0 | Yes |
| Turbo Boost Technology | 2.0 |
| Intel 64 | Yes |
| Instruction Set | 64-bit (x86-64) |
| Instruction Set Extensions | SSE, SSE2, SSE3, SSE4.1, SSE4.2, AVX, AVX2 |
| Idle States | Yes |
| Enhanced Intel SpeedStep Technology | Yes |
| Thermal Monitoring Technologies | Yes |
| Intel DL Boost | Yes |
| Threat Detection Technology (TDT) | Yes |
| Active Management Technology (AMT) | Yes |
| Intel Standard Manageability (ISM) | Yes |
| Remote Platform Erase (RPE) | Yes |
| One-Click Recovery | Yes |
| Hardware Shield Eligibility | Yes |
| Control-Flow Enforcement Technology | Yes |
| Total Memory Encryption – Multi Key | Yes |
| AES New Instructions (AES NI) | Yes |
| Secure Key | Yes |
| Trusted Execution Technology | Yes |
| Execute Disable Bit | Yes |
| Intel OS Guard | Yes |
| Intel Boot Guard | Yes |
| Mode-based Execute Control (MBEC) | Yes |
| Stable IT Platform Program (SIPP) | Yes |
| Virtualization Technology with Redirect Protection (VT-rp) | Yes |
| Virtualization Technology (VT-x) | Yes |
| Virtualization Technology for Directed I/O (VT-d) | Yes |
| VT-x with Extended Page Tables (EPT) | Yes |
Synthetic Benchmark Performance
These benchmarks are measured by CPU benchmarking software like 3DMark Time Spy CPU score, 3DMark Fire strike CPU, Passmark Performance Testsuite, CPU-Z, Cinebench, Blender, and Geekbench 6.2.
What is the Passmark Performance Test suite?
The Passmark performance test suite is a CPU benchmark designed for Processors.
It puts a load on the CPU by performing various complex mathematical calculations such as data compression, extraction, decryption, encryption, and running various physics simulations and gives the Multithreading and single core score.
What is the 3D Mark Time Spy benchmark?
It calculates both the CPU and GPU performance by rendering on 1440p resolution using DX12 API and gives you the system’s overall score. It also ranks your overall score on the internet and your system accordingly.
Time Spy Extreme also uses DX12 API to benchmark a gaming PC to its fullest capabilities by rendering it on 4K Ultra HD resolution.
What is the Cinebench benchmark?
Cinebench evaluates the rendering capabilities of both the CPU and GPU, In terms of CPUs, it evaluates its single-core and multicore potential by running CPU-heavy rendering samples.
What is the Blender benchmark?
Blender benchmarks both the CPU and GPU. In CPU, it verifies the potential in CPU-heavy workloads like Animation, physics simulations, and modeling.
What is the CPU-Z benchmark?
CPU-Z benchmarks are done by putting stress on the CPU to evaluate the single and multi-core performance of the CPU.
What is Pugetbench Benchmark?
Pugetbench benchmark is used to test CPU and GPU for rendering frames, encoding, and decoding by creating real-world scenarios for Adobe Premier Pro.
Pugetbench for Adobe Photoshop tests the speed and capability of the hardware and how fast it can open the image, resize, Image rotation, Image creation, and many more.
What is the Geekbench 6 CPU benchmark?
Geekbench 6 CPU benchmarks your processor’s computing power in daily tasks such as applications and the real-world tasks of the single-core and multicore capabilities.
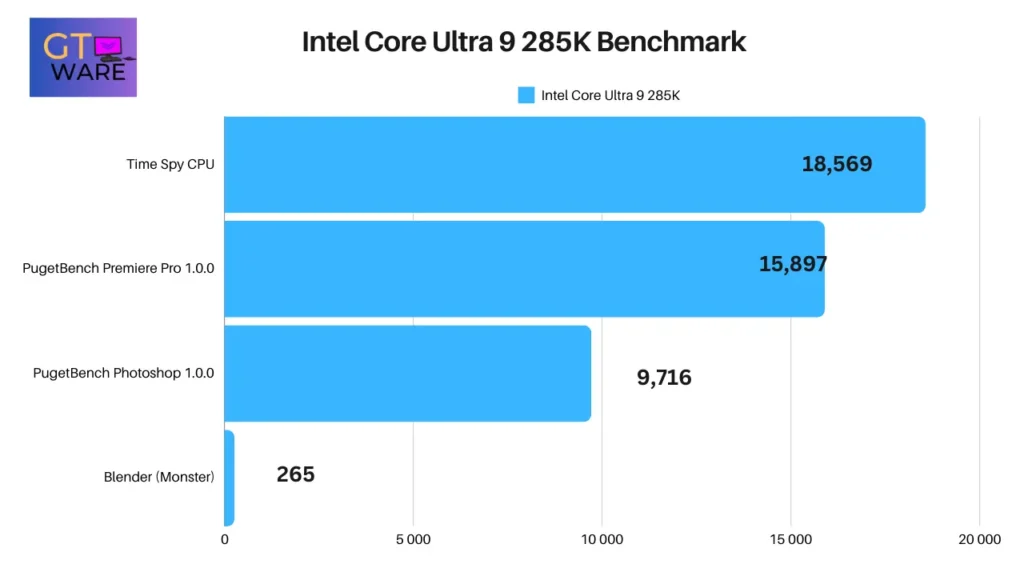
| Benchmark Tools | Intel Core Ultra 9 285K |
|---|---|
| Time Spy CPU | 18569 |
| PugetBench for Premiere Pro 1.0.0 | 15897 |
| PugetBench for Photoshop 1.0.0 | 9716 |
| Blender (Monster) | 265 |
Core 9 Ultra 285K 3dMark time spy CPU score is 18,569, Pugetbench premiere pro score is 15,897, and Pugetbench Photoshop score is 9,716 (Source: The Verge). Core 9 Ultra 285k blender score is 265 (Source: IGN)
Intel Core Ultra 9 285K Cinebench, Passmark, CPU-Z, and Geekbench benchmark

| Benchmark Tools | Single Core | MultiCore |
|---|---|---|
| Cinebench R24 | 145 | 2446 |
| Cinebench R23 | 2380 | 42620 |
| Geekbench 6 | 3221 | 21977 |
| CPU-Z | 909 | 18964 |
| Passmark | 5195 | 65873 |
Intel Core 9 Ultra 285K Cinebench R24 score for single thread is 145 and multi-thread is 2446, Geekbench 6 single-thread score is 3,221, and multi-thread is 21,977 (Source: The Verge).
The CPU-Z score for Core Ultra 9 285K in a single thread is 909 and the multi-thread is 18,964 (Source: CPU-Z). The Core 9 Ultra 285k Passmark score for single thread is 5,195 and multi-thread is 65,873 (Source: Passmark).
Intel Core 9 Ultra 28K Cinebench R23 score for Single core is 2,380 and Multi-core is 42,620.
Intel Core Ultra 9 285K Gaming Performance
Gaming performance is measured by running multiple games on this integrated graphics card and calculating the average fps and 1% lows.
The Test specs are Intel core Ultra 9 285K CPU, 32GB DDR5-7200 MHz (CL 34) RAM, Asus ROG RTX 4090 OC Edition, TeamGroup T-Force Cardea 4 TB Gen4 SSD, and Win 11 23H2.
Core Ultra 9 285K CPU performed worse in Win 11 24H2 (Source: Hardware unboxed YouTube channel)

RTX 4070 Super Gaming benchmark details in table format
| Games | 1080p Avg. FPS | 1080p 1% Low | Graphics Settings |
|---|---|---|---|
| Cyberpunk 2077: PL | 132 | 100 | High |
| The Last of Us | 196 | 146 | Ultra |
| Assetto Corsa Competizione | 159 | 138 | Epic |
| Remnant II | 121 | 106 | Ultra |
| A Plague Tale Requiem | 122 | 74 | Ultra |
| Hitman 3 | 271 | 240 | Ultra |
| Homeworld 3 | 72 | 24 | Epic, TAAU |
| Watchdogs Legion | 162 | 116 | Ultra |
| Hogwarts Legacy | 122 | 86 | High |
| Counter-Strike 2 | 508 | 254 | Med |
| Starfield | 129 | 103 | Ultra |
| Star Wars Outlaws | 134 | 104 | Ultra, Native TAA |
Is Core Ultra 9 285K good for gaming?
The Core Ultra 9 285K has taken a hit in gaming performance compared to the competitor it is performing worse. In some games, it performs worse than i5-12600K.
According to the price, the Core Ultra 9 285K doesn’t deliver the performance we expected.
How much is Core Ultra 9 285K?
The Core Ultra 9 285K price starts from $599 MSRP. The retail price is $619-$630.
What is the Core Ultra 9 285K equivalent?
The Core Ultra 9 285K processor equivalent is AMD Ryzen 9 9950X according to the price but performance wise it is comparable to AMD Ryzen 7 7700X.


